
Siacoin was at its high of $0.030 in November end, after which the coin has been correcting downwards. The coin has been registering continual decline since then. Though the SC price got tested several times at the trend line but failed to cross it. Siacoin is moving at the edges of the downtrend line, and neither the bears nor the bulls can take a strong price action. Yesterday, the coin faced a massive price plunge. However, the price needs to close above the peak of $0.012 for the trend confirmation.
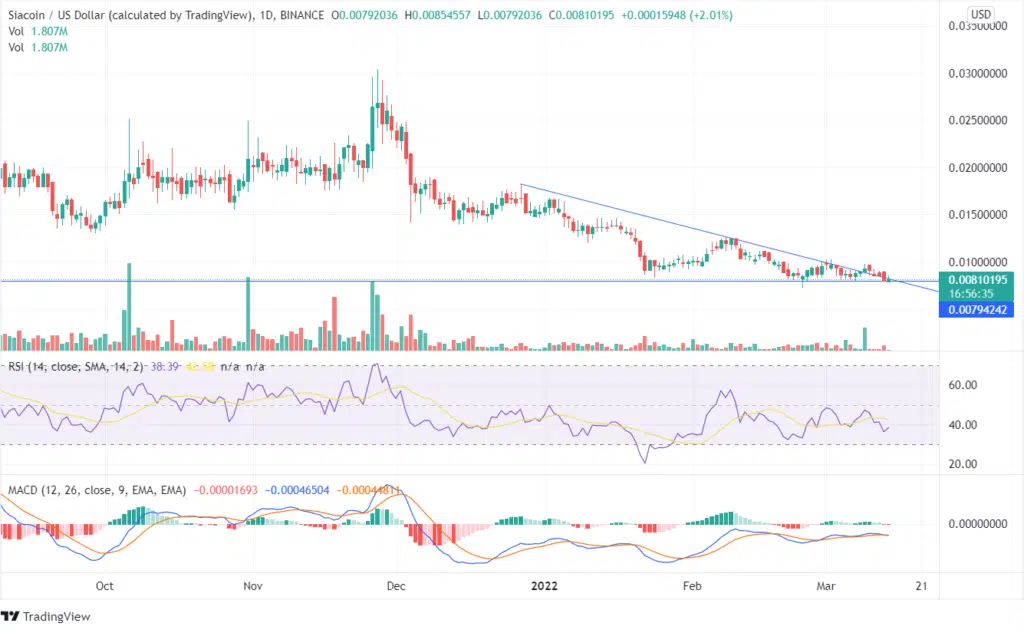
On the daily chart, the MACD line and the signal line intersect, thus not demonstrating any significant price move. On March 09, the volume bar showed a favorable bullish candle; after that, the price is constantly forming bearish candles. The RSI indicator is 39 as the price is moving in a downside direction. Once the coin price closes below $0.007, a downside momentum can be expected. However, if it closes above the swing high of $0.009, an upside trend can be expected as per the Siacoin prediction.
On the weekly time-frame, the forming bullish candle shows the price outside the trend line and the bulls trying to push the price up. The technical indicators have been showing bearishness for the past three months, and the coin has recorded an enormous plunge. The bears have gained immensely in the past few months. The previous week’s candle shows a movement of 28%, with the bulls trying to push the price up but failing to do so. A turnaround in the price can be expected if the coin continues to rise from this zone, as in the past, the coin took a hike from the same level and reached its highs.