
DigiByte currently has 72% circulating DGB tokens worth close to $505,380,900. The fall in DGB valuations from its record highs of $0.1825 to current levels of $0.03 is an 81% decline. The show of profit booking witnessed on this token is worth noting.
The fall happened from the peak value of May 2021, and unlike many other cryptocurrencies, DigiByte failed to rock a fresh high in November 2021. This trend showcases a negative sentiment on the overall purpose of this token rather than just the trading scenario.
Because of its declining market valuation, DGB has taken a huge hit in its crypto ranking, which currently stands at 141st position. DigiByte is essentially a spin-off of Bitcoin’s source code that now enables it to create a balance of power between ASIC and other miner tool users.
DGB works with five unique algorithms creating a balanced mining prowess among the validators. Governance of DGB is kept voluntary, which enables this blockchain network to remain publicly accessible. DigiByte still operates on the Proof-of-Work algorithm, which could be one of the reasons behind its declining market position. POW algorithm-based crypto tokens are taking a heavy hit since the latest cryptocurrencies are progressing towards low power consuming and more capable algorithms.
DigiByte prices indicate a clear breakout, but the uptrend would be restricted by the resistance offered by the 200 DMA curve. As of now, it could take DGB a couple of attempts before breaching this psychologically important level. On the other hand, respecting historical moving average levels could ideally help bring renewed buying sentiment.
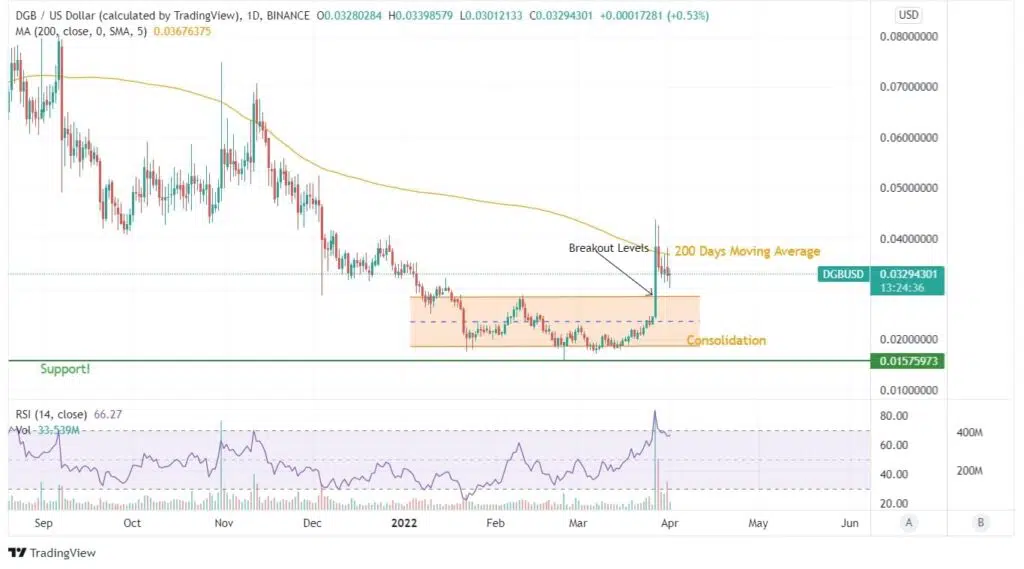
DGB broke out of its consolidation levels, but 200 DMA resistance has thrown back the rally again. For now, the higher wicks on the positive and negative end of daily candles show increasing participants in the tokens valuations.
With RSI hitting overbought zones, one should ideally wait for a retracement before making fresh entries into DGB. Similar price action in November 2021 was registered, and failure to secure the 200 DMA levels forced DGB to succumb to selling pressure. Check out DigiByte price prediction to know if the 200 DMA resistance will be broken.
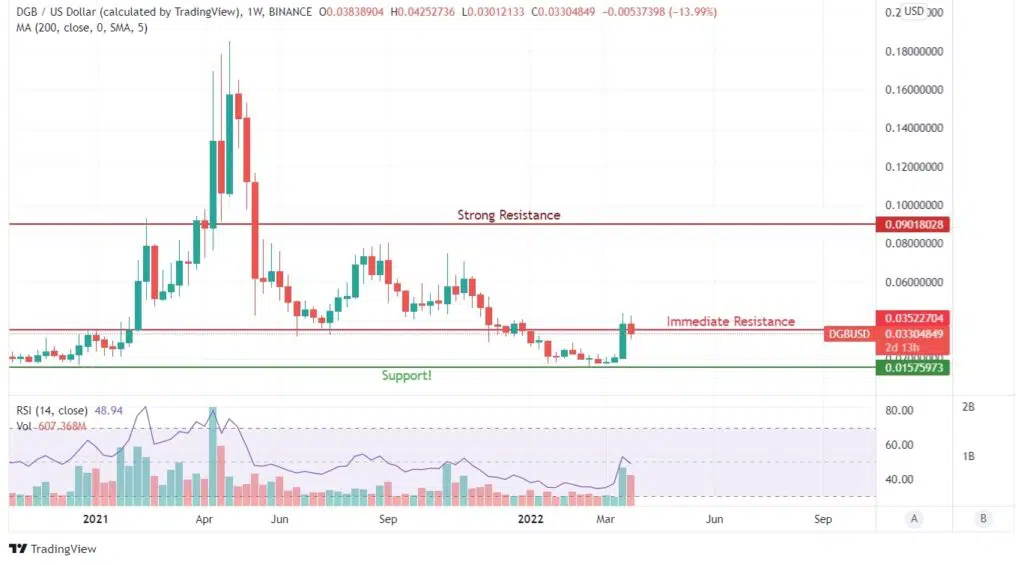
On Monthly charts, the crest and trough of DGB price action show the prior support of the $0.033 level to have turned into a resistance level. A pullback rally from current levels can push DGB to at least the $0.08 level in the coming days. RSI levels are rising, but the sentiment will have to withstand the resistance levels and profit booking pressure from buyers who are in profit at current levels.
Resistance would carry ahead to $0.09 levels from a long-term perspective. Only after prices breach, these levels can traders expect good upside movements for DGB.